User Interface
You start with two pre-defined empty dashboards — Auto and Teleop. These dashboards can not be deleted.
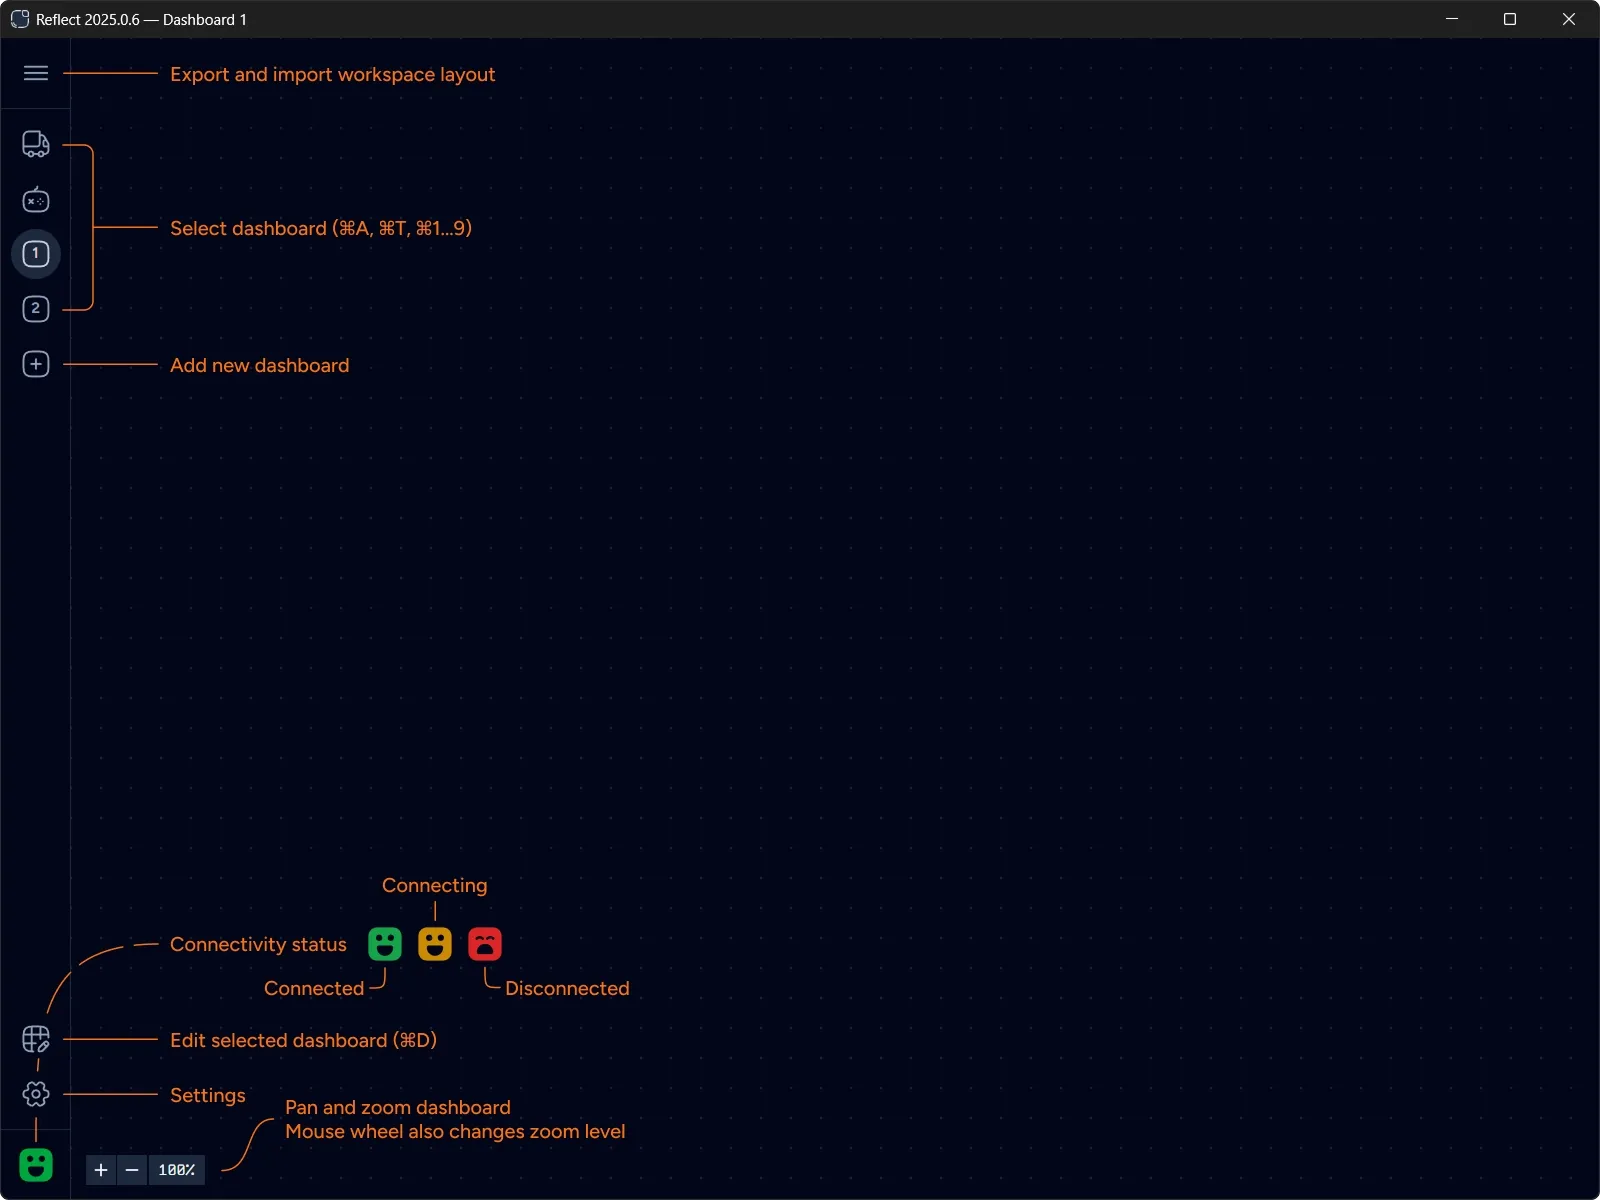
Create additional dashboards by clicking Add dashboard button. Up to 9 custom dashboards can be created.
Changes are saved automatically and are kept in a file stored locally in the user’s application settings folder (platform specific).
You can export dashboards configuration into a workspace file to transfer between computers or to maintain different layouts. Importing a workspace file overrides the current dashboards configuration.
Connecting to Robot
Section titled “Connecting to Robot”Reflect uses Network Tables to connect to the robot code. Use Settings to select how Reflect discovers the IP address of the robot.
Reflect connects automatically and keeps trying until the connection is successful.
If you ever find it stuck press ⌘+R to reload the application.
The robot face glyph in the bottom-left corner depicts the current status of the connection.
| Icon state | Description |
|---|---|
| Green happy | Connected |
| Yellow happy | Trying to connect |
| Red sad | Disconnected |
Editing Dashboards
Section titled “Editing Dashboards”Click Edit dashboard button or press ⌘+D to switch into Editing mode.
You can then drag-and-drop and configure widgets in the currently selected dashboard.
Canvas Controls
Section titled “Canvas Controls”Dashboard canvas supports panning and zooming. Zoom level can be adjusted via mouse wheel or zoom buttons in the bottom-left corner.